Our Work
Stock Market Machine Learning Program
An advanced machine learning system for predicting stock market trends using historical data.
Machine Learning Overview
Objective
The primary goal of our machine learning engine is to predict the percentage growth of a company's Market Capitalization over specific future horizons (1, 3, or 5 years). By analyzing historical financial data, the system identifies patterns that correlate with future value appreciation.
Data & Feature Engineering
We process thousands of annual financial reports (10-K) of US stocks to extract standardized metrics. Raw financial data is transformed into meaningful features for the machine learning algorithms:
- CAGR (Compound Annual Growth Rate): Calculates the annualized growth rate of key metrics (e.g., Revenue, Net Income) over the analysis horizon. This captures the momentum of a company's financials.
- Valuation Ratios: Calculates the ratio of Market Cap to a metric (e.g., Price-to-Earnings, Price-to-Sales). This captures how expensive the stock is relative to its fundamentals.
- Log-Transformed Valuation: Applies a logarithmic transformation to valuation ratios to help linearize the relationship between valuation and growth, as valuation multiples often follow a power law.
- Volatility: Calculates the standard deviation of the year-over-year growth rates of a metric, measuring the stability or risk associated with that financial metric.
Note: Feature values are "clipped" to the 1st and 99th percentiles to remove data errors and extreme outliers, ensuring robust predictions.
Algorithms
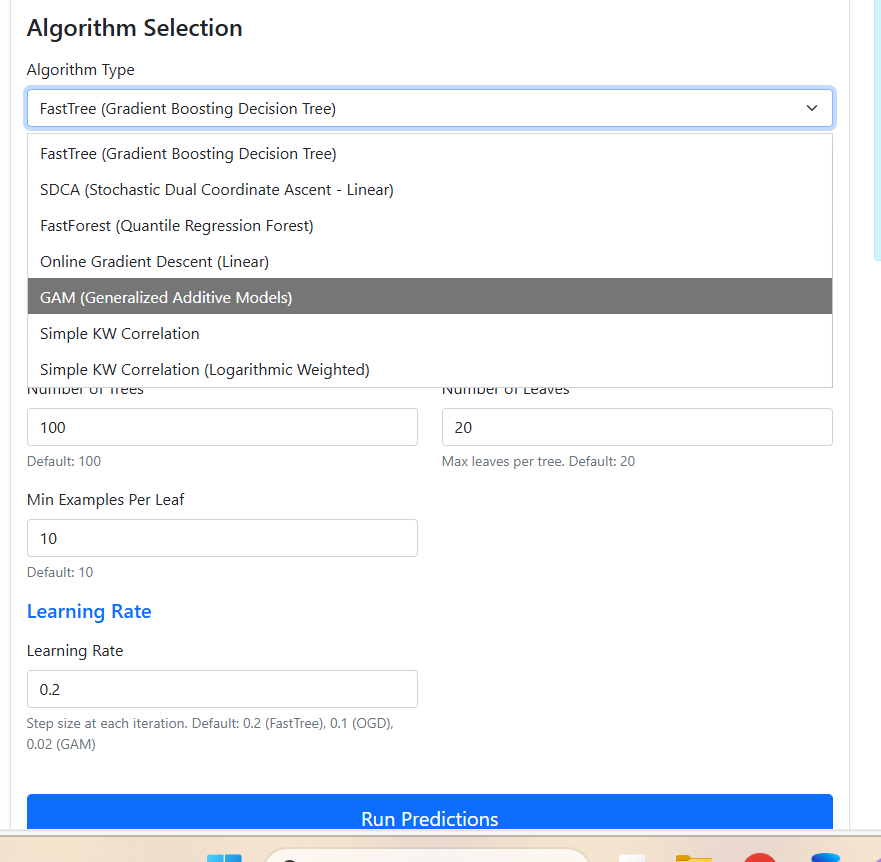
We utilize the Microsoft ML.NET framework to train and evaluate multiple regression algorithms:
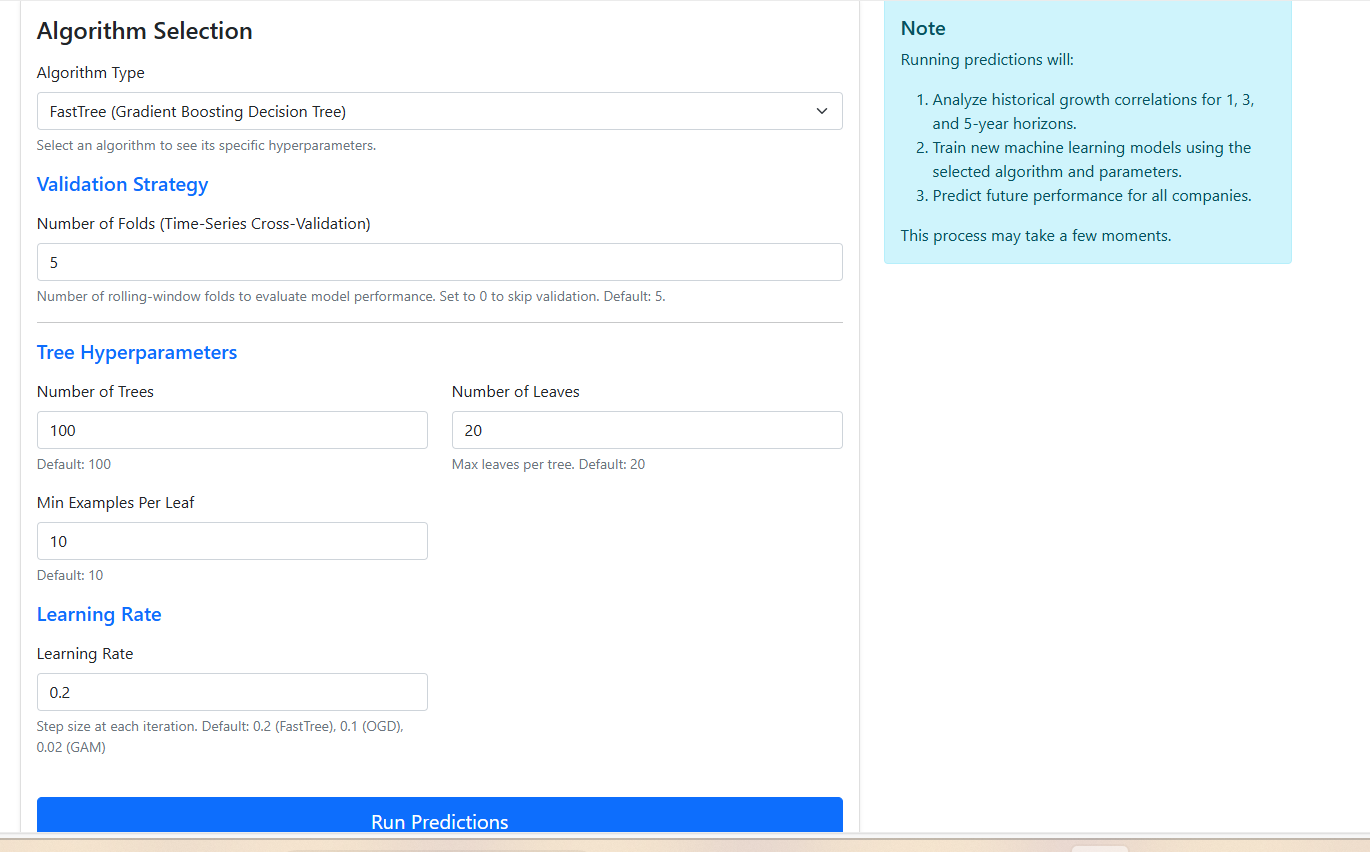
- FastTree (Gradient Boosting Decision Tree): An ensemble of decision trees where each tree corrects the errors of the previous ones. Excellent for capturing non-linear relationships and interactions between features.
- SDCA (Stochastic Dual Coordinate Ascent): A linear regression algorithm optimized for large datasets, using regularization to prevent overfitting. Best suited when relationships are relatively linear.
- FastForest (Quantile Regression Forest): Builds multiple decision trees in parallel and averages their predictions. Generally robust to overfitting.
- GAM (Generalized Additive Models): Models the target as a sum of non-linear functions of individual features, offering a balance between interpretability and flexibility.
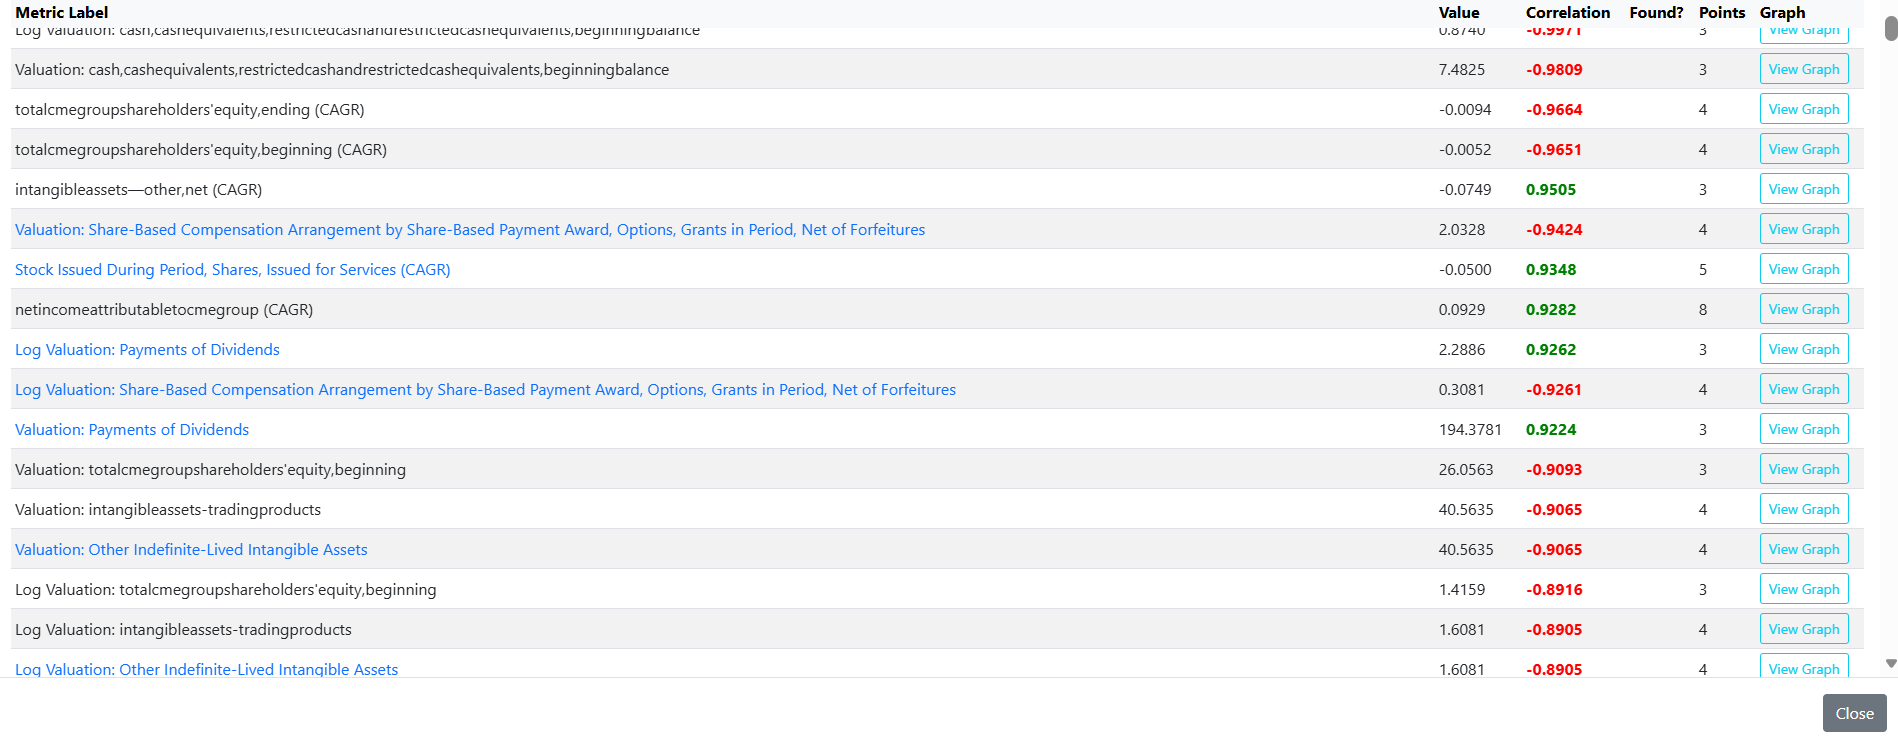
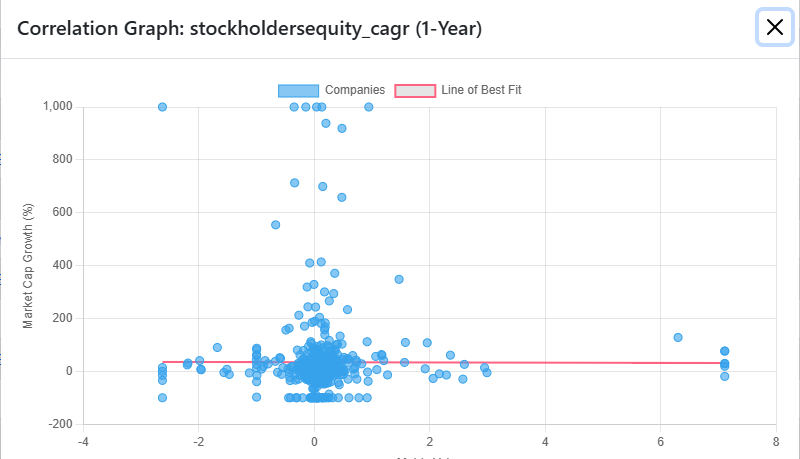
- Customised Correlation Gradient: A custom heuristic algorithm that weights features directly by their historical Pearson correlation with market cap growth.
Validation Strategy
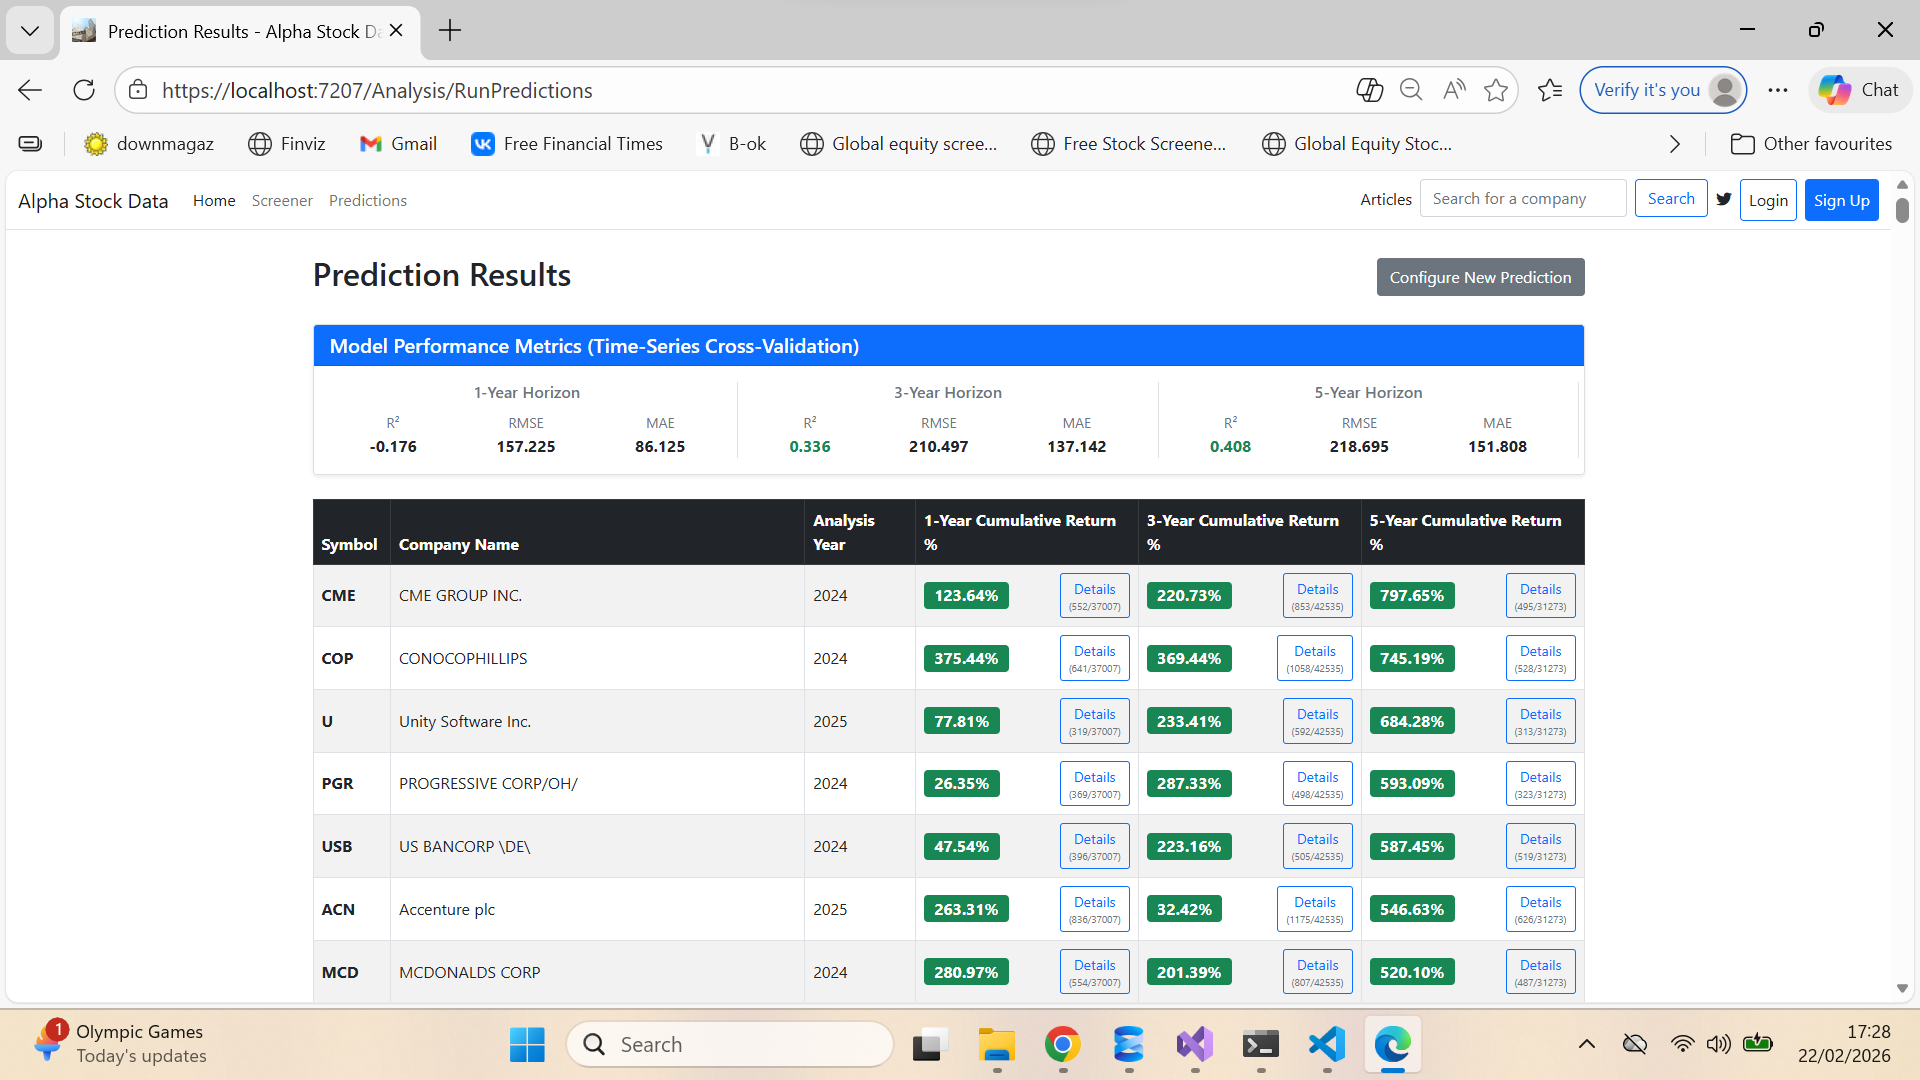
To ensure our models are not just memorizing the past ("overfitting"), we use a rigorous Time-Series Cross-Validation approach (Rolling Window). Instead of random splitting, we split data by time. For example, to test the model's ability to predict 2023 performance, we train only on data from years prior to 2023. We repeat this for multiple past years and average the performance metrics (R-Squared, RMSE, MAE) to gauge reliability.
Stock Data Website
A comprehensive platform for visualizing and analyzing stock market data.
Stock Data Platform Overview
Objective
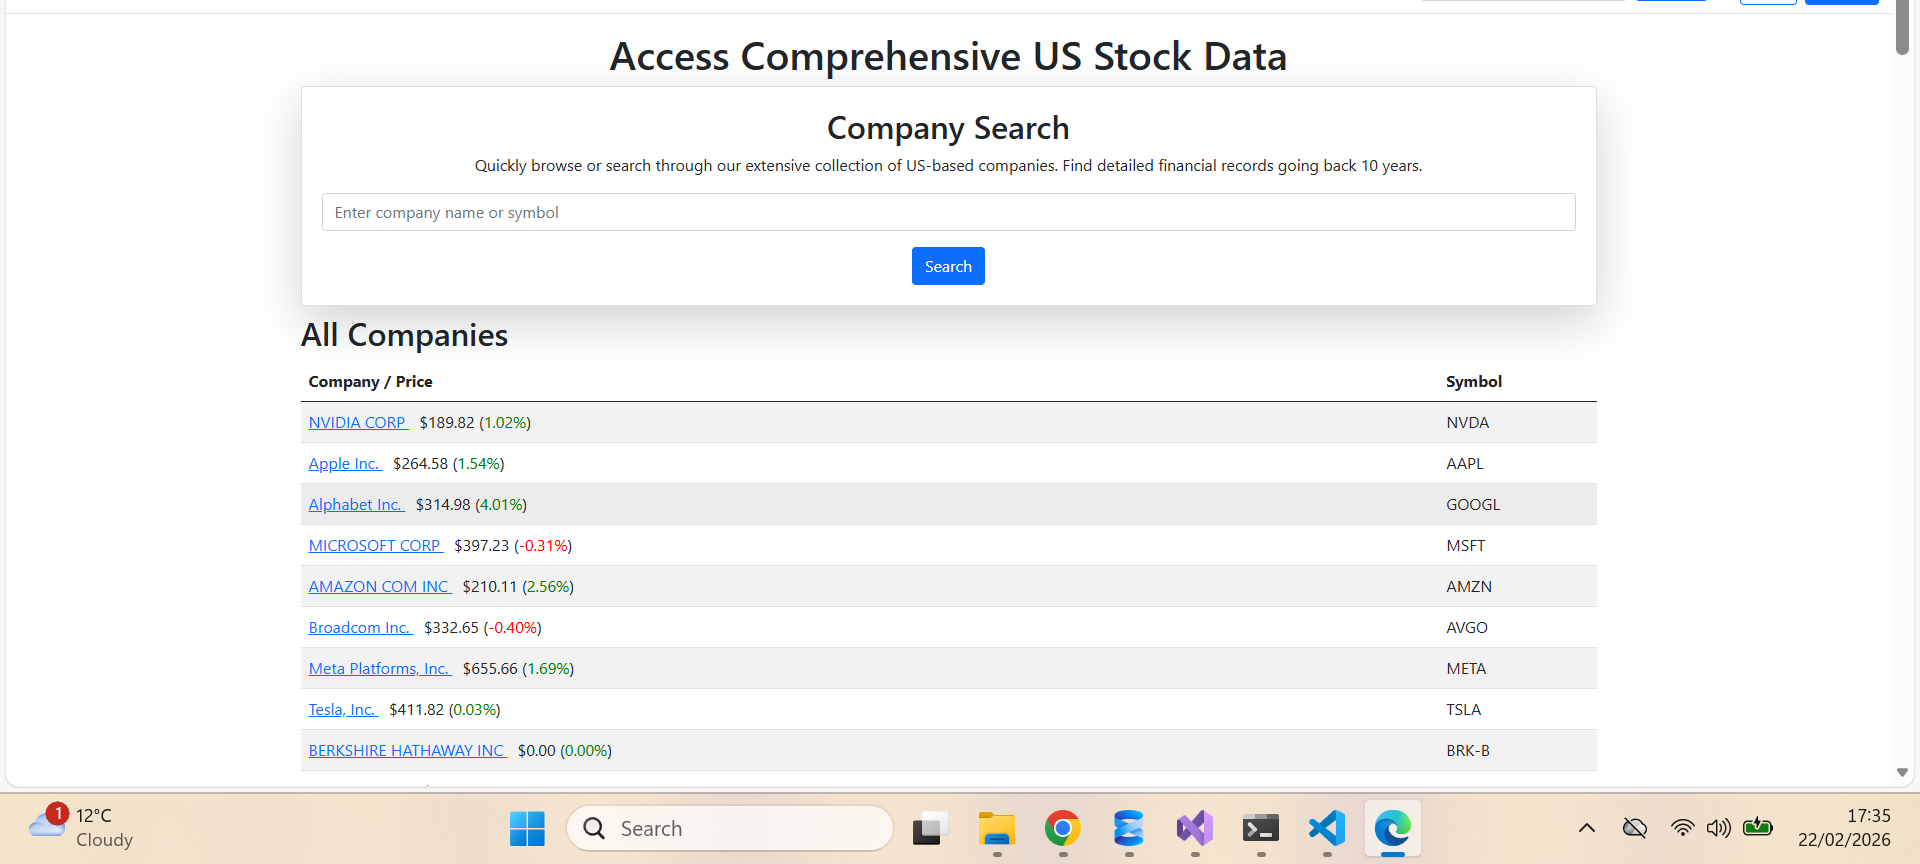
The Stock Data Platform is designed to provide investors and analysts with comprehensive, highly detailed, and accessible financial data for thousands of publicly traded companies. By aggregating raw data from official filings and presenting it through intuitive visual interfaces, the platform empowers users to make data-driven investment decisions.
Core Features
- Advanced Stock Screener: A powerful screening tool that allows users to filter the entire universe of available stocks based on custom financial criteria. Users can discover investment opportunities by screening for specific thresholds in metrics such as Market Capitalization, Revenue Growth, and P/E ratios.
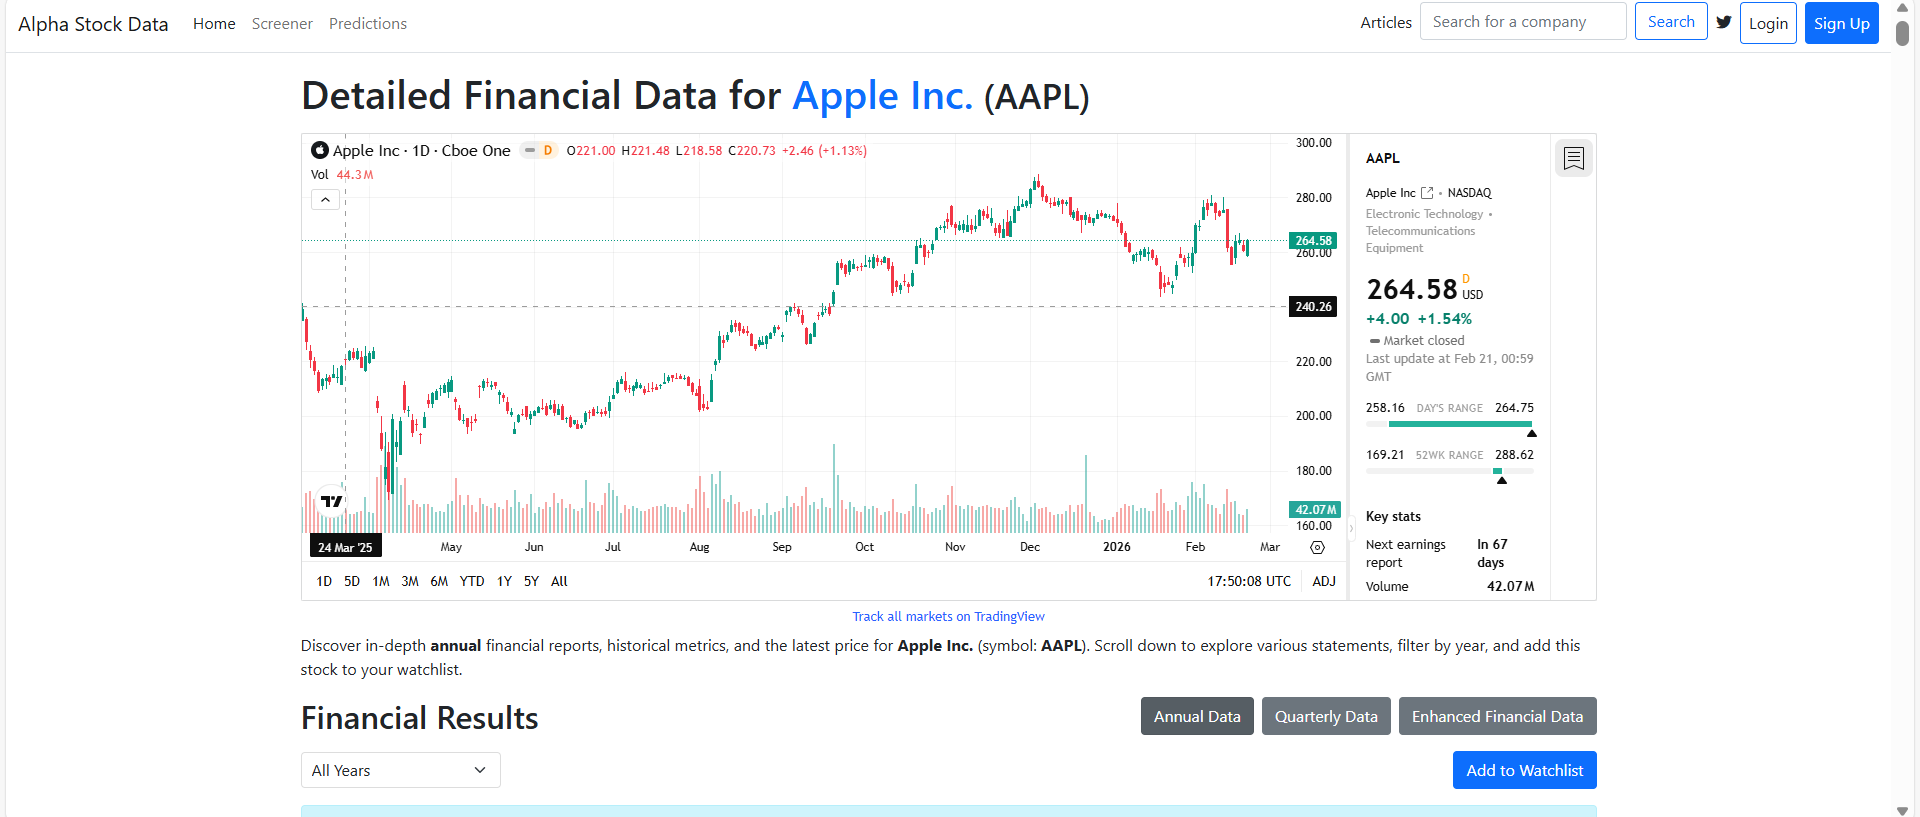
- Comprehensive Company Profiles: Deep-dive pages for individual equities featuring real-time pricing, industry classification, corporate descriptions, and historical context.
- Interactive Financial Visualizations: Dynamic, interactive charts powered by Chart.js. Users can visualize historical performance (Revenue, Net Income, etc.), customize year ranges, and compare metric trajectories.
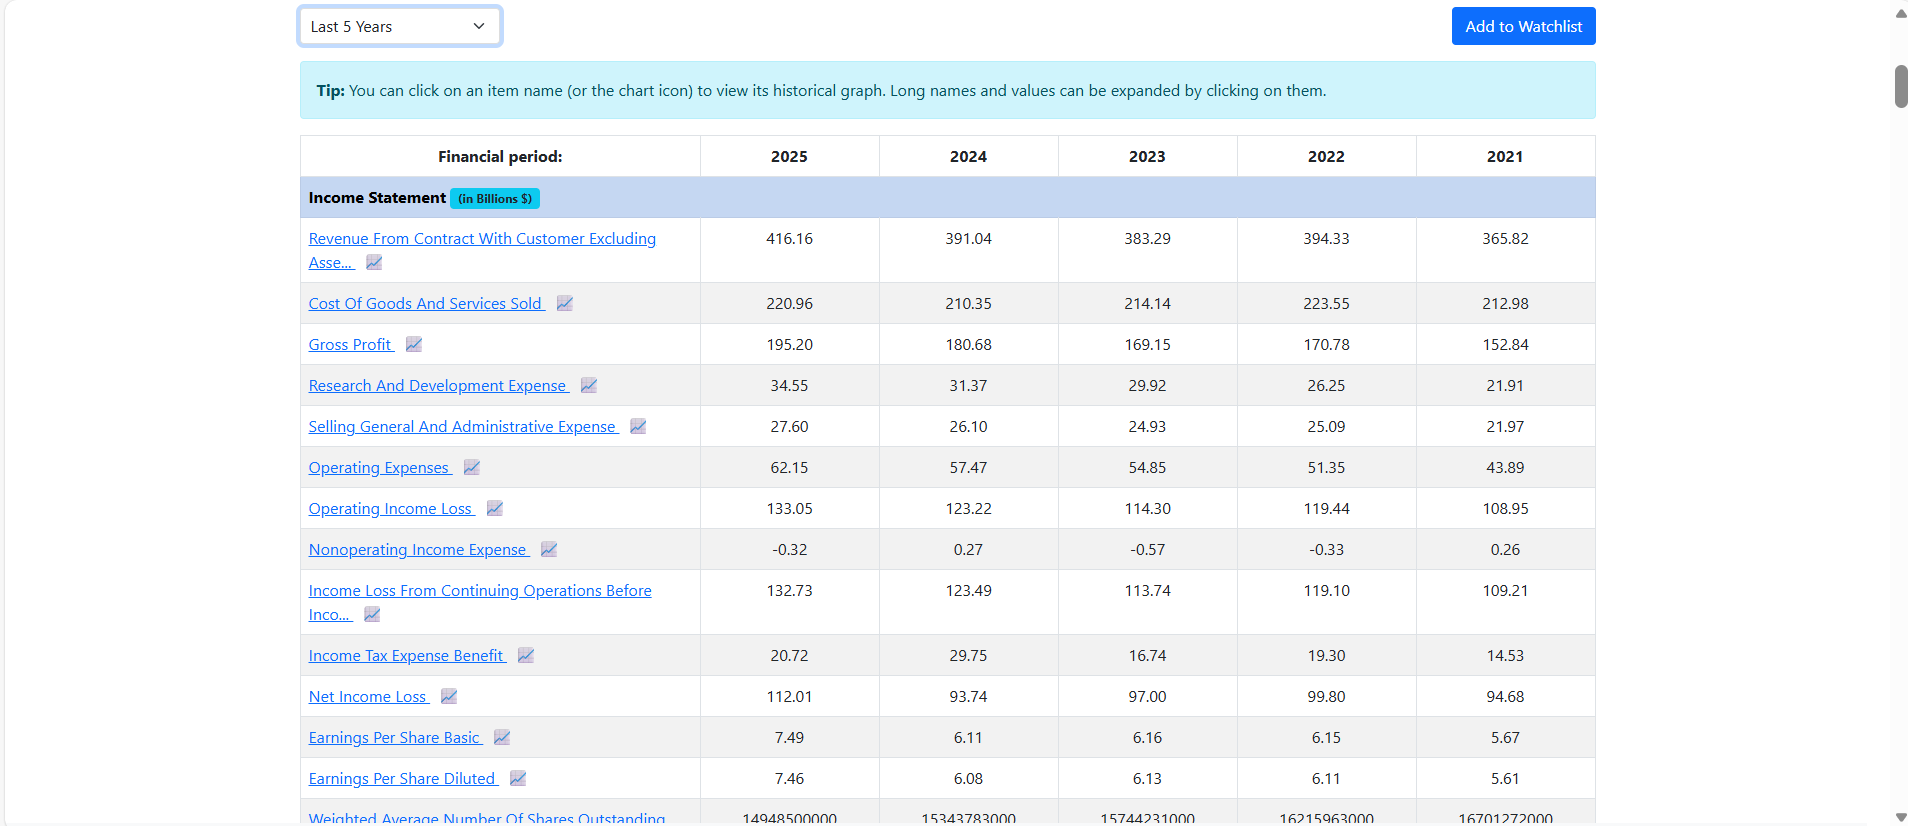
- Detailed Financial Statements (HTML & XBRL):
- Data is extracted directly from official SEC 10-K and 10-Q filings.
- A dual parsing engine handles both HTML tables and raw XBRL tags for maximum accuracy.
- Official XBRL definitions are available for each metric to ensure transparency.
- Personalized Watchlists & User Accounts: Secure accounts allowing registered investors to build and track their favorite companies for quick access.
Data Pipeline & Architecture
The application runs on a robust backend (ASP.NET Core & Entity Framework Core) with automated background services:
- Data Aggregation: Combines official SEC scraping with third-party APIs (Financial Modeling Prep, TwelveData) for a highly accurate repository.
- Automated Updates: Background hosted services continuously refresh price data and process new filings as they are released.
Horse Racing Results Predictor
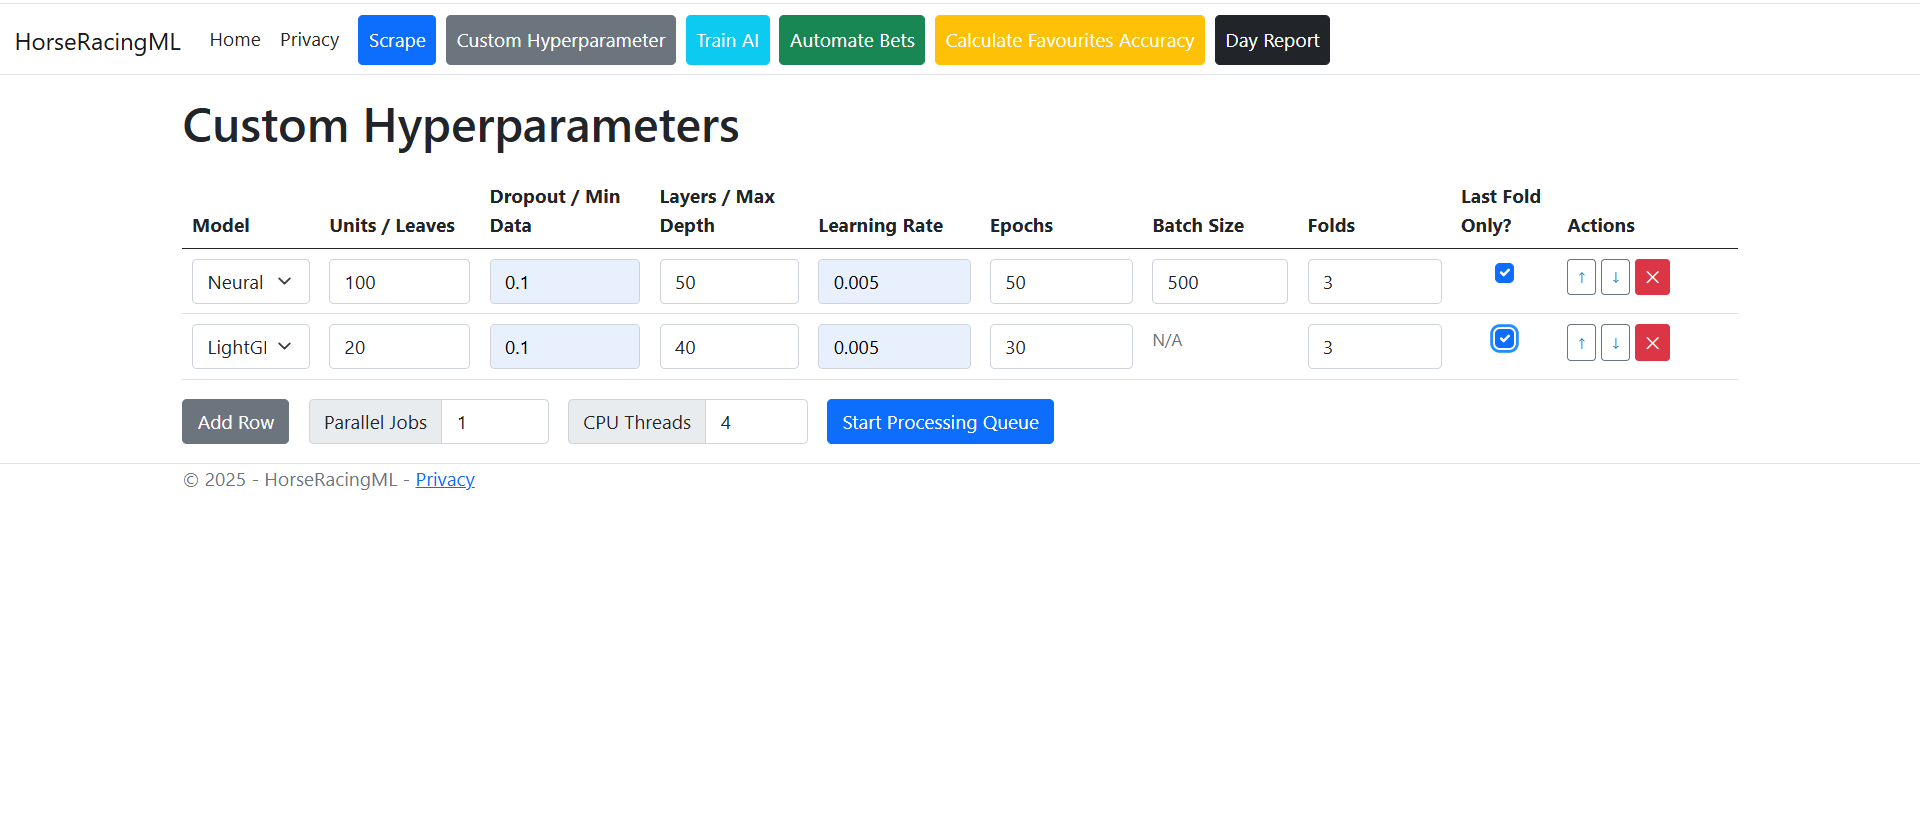
Our platform leverages advanced machine learning to analyze historical racing data, evaluate complex relationships between horses, trainers, jockeys, and course conditions, and generate highly accurate probabilities for upcoming races.
Core AI Capabilities & Engineering
1. Advanced Hybrid Modeling (The Core Engine)
Our flagship predictive engine utilizes a Hybrid Model architecture, combining the strengths of two industry-leading algorithms:
- Deep Neural Networks (TensorFlow): Excellent at uncovering complex, non-linear patterns within continuous numerical data (like speed ratings, beaten lengths, and historical probabilities).
- Gradient Boosting (LightGBM): Highly effective at processing vast amounts of categorical data (like jockey IDs, race classes, track surfaces, and weather conditions) and finding rules-based edges.
By intelligently partitioning the data—feeding numerical features into the Neural Network and categorical/ranking features into LightGBM—and ensembling their outputs, our system captures nuanced patterns that a single model would miss, resulting in a more robust and accurate edge against the market.
2. Sophisticated Feature Engineering
The AI is only as good as the data it’s given. We’ve built a massive, dynamically updated feature engineering pipeline that transforms raw race results into over a hundred highly predictive data points for every runner:
- Deep Historical Form & Speed Analysis: The model analyzes a horse’s recent form (last 1, 3, 5, and up to 100 races), calculating moving averages, standard deviations, and trend slopes for speed, class, official ratings, and finish positions.
- Context-Aware Performance: We don’t just look at overall win rates. The AI evaluates a horse’s historical success specifically on today's Surface (e.g., Turf, Dirt, All-Weather), Going (e.g., Good, Soft, Heavy), and Distance Bucket (Sprint, Middle, Long), adjusting its expectations accordingly.
- Trainer & Jockey Synergy: We track rolling statistics for every trainer and jockey, evaluating their recent form (e.g., last 50 starts or 180 days). We also calculate their specific win rates at the current course and, most importantly, the historical synergy when a specific trainer and jockey pair up.
- Volatility & "Shock" Tracking: Our system measures "Volatility"—how often a horse, jockey, or trainer produces an unexpected result (finishing >5 places away from their historical average). This helps the model identify inconsistent runners versus reliable performers.
- Race-Level Relativity: Features aren't calculated in a vacuum. A horse’s speed or weight is measured relative to the field (e.g., "Speed Z-Score," "Weight Difference from Mean," "Is Class Dropper"). This ensures the model understands a runner’s true competitive standing in today's specific matchup.
- Layoff & Rest Analysis: The model calculates exact days since a horse’s last race and categorizes layoffs (short, medium, long), identifying if a horse is running its critical "second run off a layoff."
3. Intelligent Training & Walk-Forward Validation
To ensure our AI doesn't just memorize past results (overfitting), we employ rigorous training methodologies:
- Time-Series Validation: The model is trained using a strict walk-forward approach. It only learns from races that occurred chronologically before the races it is being tested on, perfectly simulating real-world predictive environments and eliminating "look-ahead bias."
- Focal Loss Optimization: Because only one horse wins a race, betting data is highly imbalanced (many losers, few winners). We utilize Focal Loss during training, forcing the Neural Network to focus harder on the difficult, edge-case predictions rather than the obvious favorites.
4. Real-Time Application & The "Day Report"
The power of our historical modeling is applied to live betting markets daily:
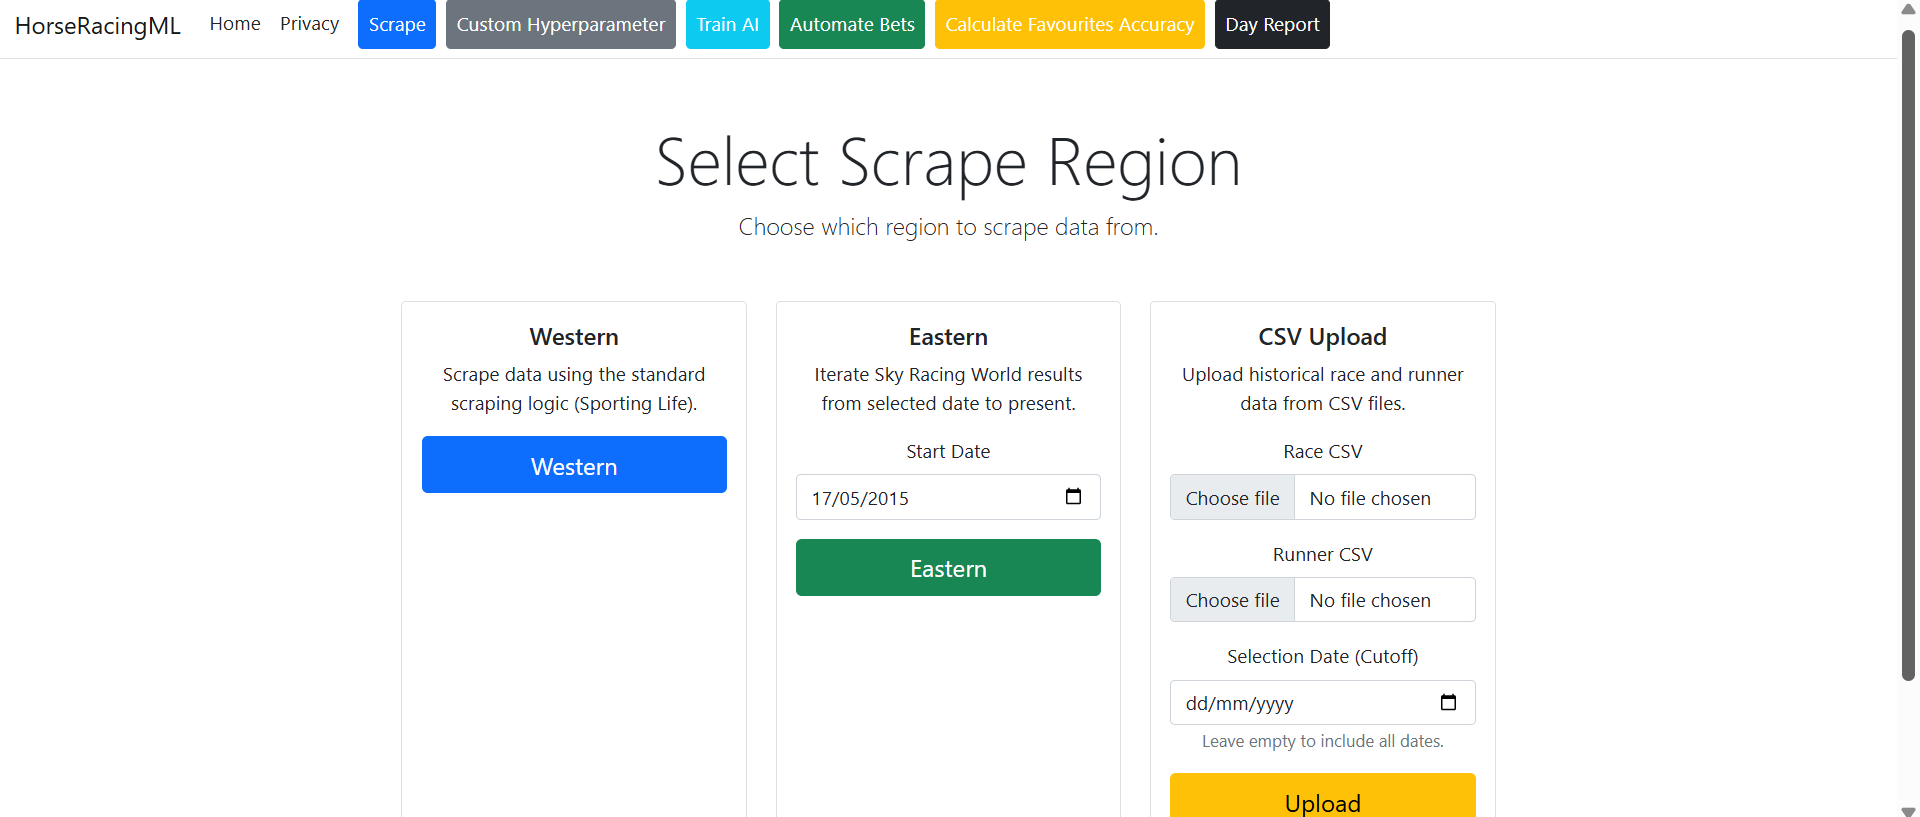
- Automated Market Scraping: The system dynamically connects to live betting exchanges (like Betfair) to pull in today's upcoming races, runner fields, and live odds.
- On-the-Fly Feature Generation: For every upcoming race, the system instantly cross-references live runners with our deep historical database, calculating all 100+ predictive features (like jockey course win rates and speed slopes) in milliseconds.
- Live Edge Detection: The AIOddsCalculator generates an independent probability for every runner. This is instantly compared against live market odds (Back and Lay) to detect profitable discrepancies, highlighting exactly where the AI’s opinion differs from the public money.
- Market Fallback Protection: If a horse lacks sufficient historical data (e.g., a debut runner), the system intelligently detects this and utilizes a market-implied probability fallback to ensure betting bankrolls are protected from unpredictable variance.
Stock Market Data Scraper
Financial Data Scraper Engine
Objective
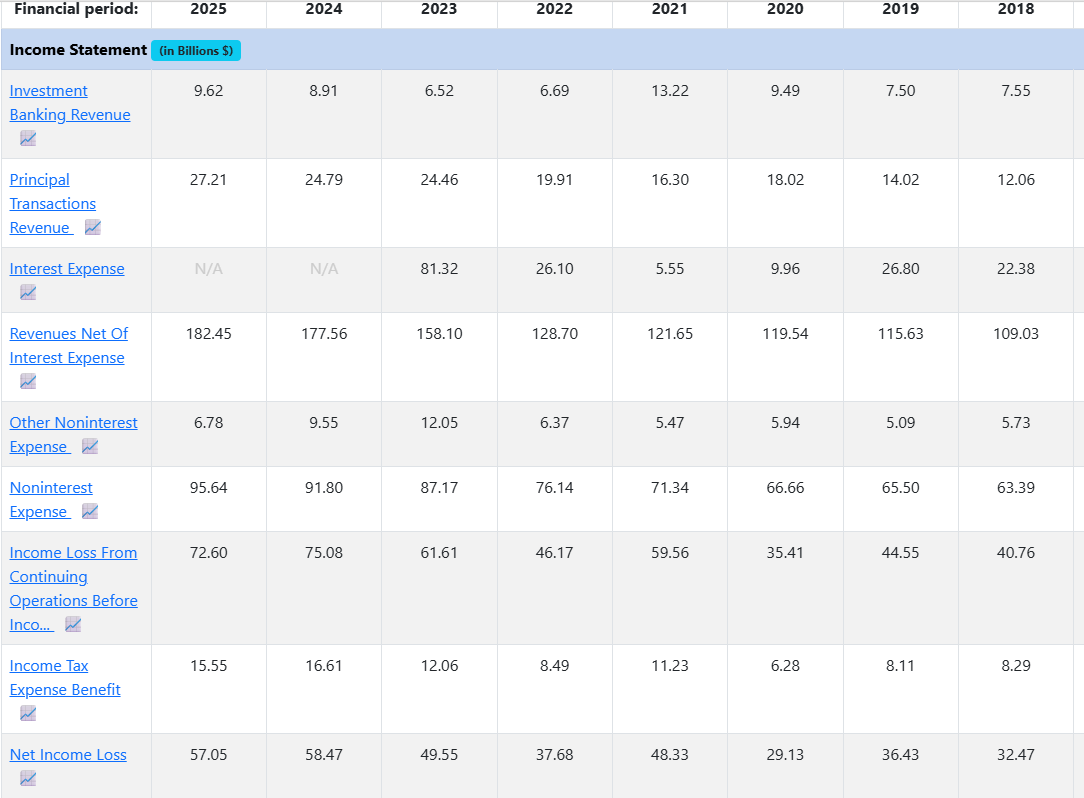
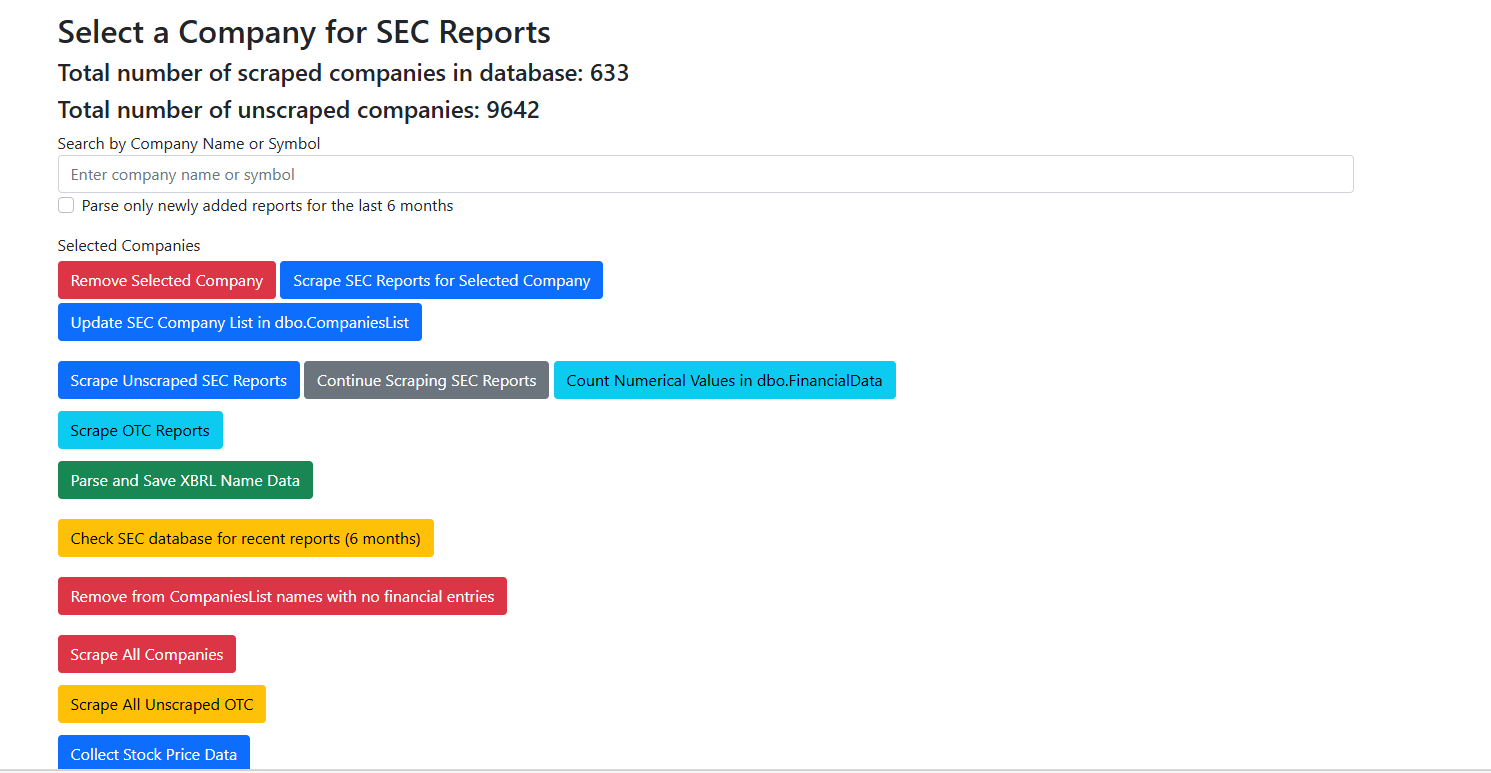
The Scraper Engine is the automated data ingestion pipeline for the Stock Data Platform. Its primary goal is to securely and efficiently download, parse, and structure raw financial filings from the US Securities and Exchange Commission (SEC) EDGAR database, which contains corporate financial data for all US stocks, turning complex regulatory documents into accessible, machine-readable financial data.
Architecture & Automation
The scraping system is built for scale and reliability, utilizing asynchronous, multi-threaded operations to process data for thousands of publicly traded companies.
- Parallel Processing: The engine utilizes parallel execution (up to 10 concurrent company streams) to rapidly ingest historical data and catch up on missing quarterly reports.
- Sequential Scraper: A background service orchestrates the overarching process, iterating through the entire universe of companies to ensure no 10-K (Annual) or 10-Q (Quarterly) filing is missed.
- State Management: The engine intelligently checks the local database before making external requests, avoiding redundant downloads and saving bandwidth.
SEC EDGAR Integration
The application interfaces directly with the SEC EDGAR APIs and document archives.
- Entity Identification: It maps standard ticker symbols to SEC Central Index Keys (CIKs) to ensure accurate document retrieval.
- Submission Aggregation: It downloads the master submission JSON files for each company, parsing both recent and historical filing records.
- Rate Limiting & Compliance: The engine is built to respect external API rate limits, handling requests gracefully to maintain uninterrupted access to SEC data.
Dual Parsing Engine
Financial filings are notoriously complex and inconsistently formatted. To extract accurate data, the application uses a sophisticated dual-layered parsing approach:
1. Inline XBRL Extraction (Quantitative Data)
The engine parses the raw HTML/XML files using HtmlAgilityPack to extract Inline XBRL (eXtensible Business Reporting Language) facts.
- Context Resolution: It maps numerical facts to their specific periods (Start Date, End Date, Instant) and dimensions.
- US-GAAP Filtering: It strictly isolates
us-gaap:tags to ensure only standardized accounting metrics are saved. - Data Cleaning: It standardizes numeric values by handling HTML entities and correctly applying negative signs and scaling factors.
2. HTML Table Parsing (Human-Readable Formatting)
As a fallback and to preserve visual structure, the engine also parses standard HTML tables.
- Intelligent Column Selection: Uses a voting algorithm to determine the best data column, ignoring spacer columns and metadata.
- Section Splitting: Uses regular expressions to identify major headers and split massive tables into logical sections (e.g., "Consolidated Balance Sheets").
Error Handling & Resiliency
The scraper is designed to be fault-tolerant:
- Graceful Degradation: If XBRL extraction fails, the engine automatically falls back to raw HTML table parsing.
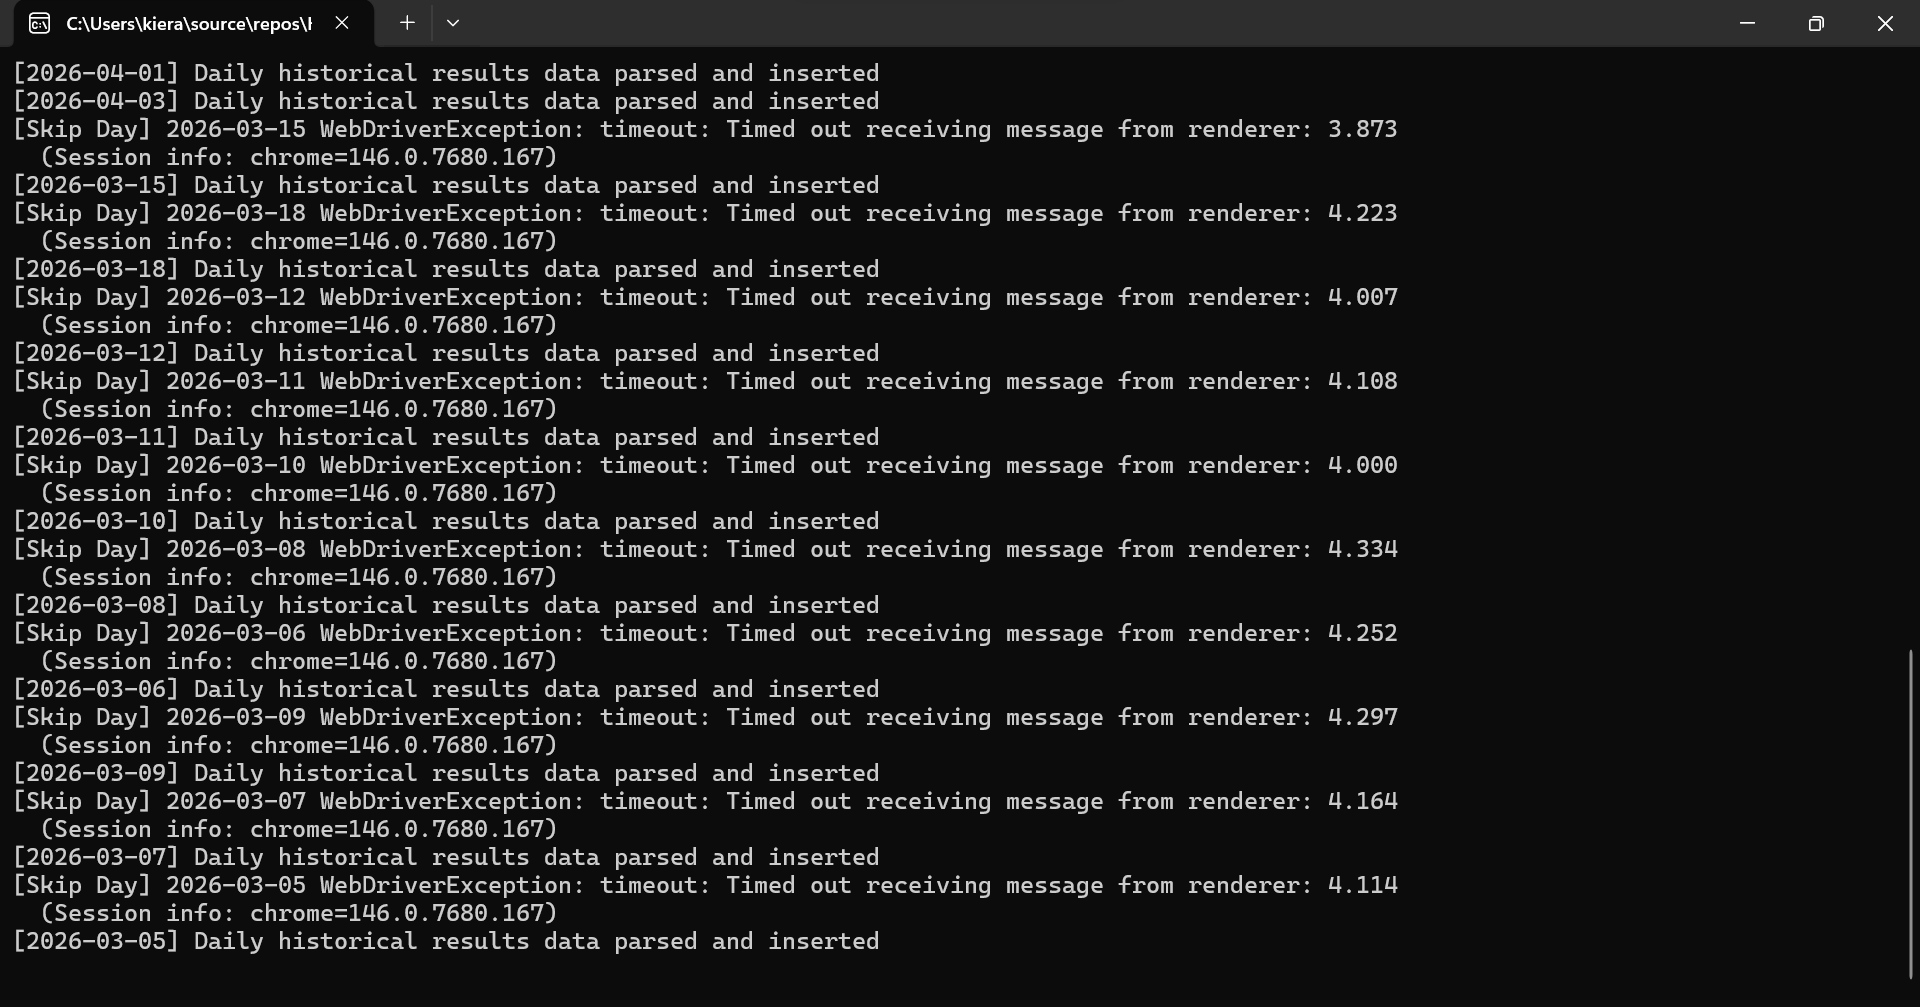
- Detailed Logging: Comprehensive logging tracks every single filing processed, allowing for real-time monitoring of the data pipeline health.
Automated Betting Handler
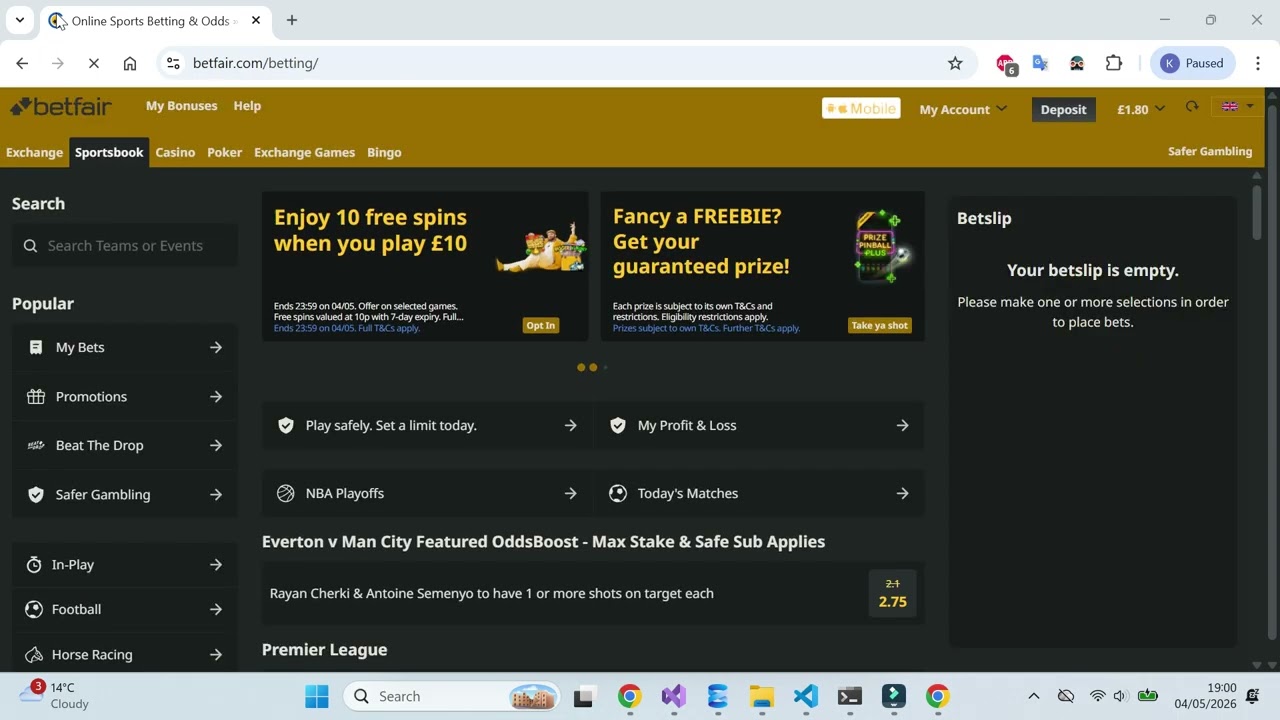
While our machine learning models identify where the value lies, our Automated Betting Handler is the engine that acts on it. Designed for speed, precision, and risk management, this system autonomously navigates live betting markets, calculates complex betting strategies in real-time, and executes wagers instantly—completely removing the need for manual intervention.
Automated Execution System Overview
Here is a high-level overview of how our automated execution system operates.
1. Autonomous Market Navigation & Live Scraping
The system does not rely on delayed data feeds. Instead, it interacts directly with live betting exchanges (like Betfair) using intelligent browser automation.
- Automated Scheduling: The
BetfairNavigationServicecontinuously monitors the daily racing schedule, autonomously opening tabs for upcoming races within a specific time window (e.g., races starting in the next 10 minutes). - Real-Time Data Extraction: As market conditions change second-by-second, the scraper instantly extracts live "Back" and "Lay" odds, runner statuses, track conditions ("Going"), and even live bankroll balances.
- Session Management: The system is built to handle the realities of web automation. It can detect invalid sessions, automatically re-authenticate, handle cookie banners, and manage background browser tabs to ensure it never misses a race.
2. Dynamic Value Detection & Market Fallbacks
Once the live market data is scraped, the system immediately cross-references it with the AI's predictions.
- Live Edge Calculation: The system compares the AI's predicted probability against the live market-implied probability (the current odds). If the AI believes a horse has a 20% chance to win, but the market odds imply only a 10% chance, the system flags a positive "differential" or edge.
- Safety Mechanisms (Degeneracy Fallback): The automation is designed to protect your bankroll. If the AI model generates an abnormally low probability (or if a horse lacks sufficient historical data), the system automatically defaults to using the market-implied odds, and no bet is placed on that horse nor does it afect the calculated odds of any other horse. This ensures the system does not place reckless bets on highly uncertain runners (like debut horses).
3. Intelligent Risk Management & Staking
Finding an edge is only half the battle; sizing the bet correctly is where long-term profitability is made. Our system employs advanced mathematical staking strategies.
- The Kelly Criterion: Rather than placing flat bets, the system utilizes the Kelly Criterion to size bets proportionally to the size of the perceived edge and the available odds. The larger the edge, the larger the stake—optimizing bankroll growth while minimizing the risk of ruin.
- Customizable Dampeners & Limits: We understand that full Kelly staking can be volatile. The system supports "Kelly Dampeners" (e.g., Half-Kelly or Quarter-Kelly) to reduce variance. It also enforces strict maximum stake limits—either as a fixed monetary amount or a maximum percentage of your total bankroll.
- Sequential Bankroll Allocation: When multiple value bets are identified in the same race, the system intelligently allocates stakes sequentially. It recalculates the remaining available bankroll after every simulated bet to ensure it never attempts to stake more money than is currently in the account.
4. Lightning-Fast Bet Execution
When a profitable opportunity is confirmed and the stake is calculated, the system moves to execution.
- Automated Interface Interaction: The system bypasses manual clicking. It uses precise CSS selectors and JavaScript injection to instantly locate the correct "Back-All" buttons for the specific horse, populate the bet slip with the exact dynamically calculated stake, and place the wager.
- Fallback Selectors: Betting exchange UIs change frequently. Our automation is built with robust fallback logic—if a button's ID changes, the system seamlessly cycles through a hierarchy of alternative visual and structural selectors to ensure the bet is placed without throwing an error.
- Confirmation & Accounting: Once bets are placed, the system verifies the placement and instantly updates its internal ledger, deducting the staked amount from the active bankroll so it is perfectly calibrated for the very next race.
Table Tennis Results Predictor
Machine Learning Technical Summary
1. Machine Learning Architecture & Model
The core machine learning functionality is encapsulated in the TFModelService class, which uses TensorFlow.NET (Tensorflow.KerasApi) to build and train neural network models.
Architecture Overview
The system is designed to predict the probability of Player 1 (P1) winning a table tennis match against Player 2 (P2). It formulates this as a binary classification problem.
Supported Model Types
The model architecture dynamically adapts based on whether sequential data is used (defined by SequenceLength).
- Sequential Data (RNN/TCN) (SequenceLength > 1): Utilizes Long Short-Term Memory (LSTM) networks by default, supporting multiple layers with dropout. It also supports Gated Recurrent Units (GRU) and Temporal Convolutional Networks (TCN) using
Conv1Dlayers with causal padding and global average pooling. - Tabular Data (Dense Neural Network) (SequenceLength == 1): Utilizes a Multi-Layer Perceptron (MLP) architecture including standard
Dense,BatchNormalization, andDropoutlayers. It uses ReLU activation for hidden layers and Sigmoid for the output layer to produce a win probability between 0 and 1.
Optimization & Loss
- Optimizer: Adam optimizer with a configurable learning rate.
- Loss Function: Binary Crossentropy (
keras.losses.BinaryCrossentropy()). - Metrics: Accuracy.
2. Feature Engineering
The model uses a strictly defined vector of 66 features (InputSize = 66) to represent a match. These features are extracted and engineered from historical database records and populated into the TrainingMatch object.
The features can be broadly categorized into:
- Player Performance & Streaks: Win rates, recent trends (15/30/60/90 days), win/loss streaks, 5-set game rates.
- Head-to-Head (H2H): Historical win differences and set/point differences between the two specific players.
- Workload & Fatigue: Games played on the same day, previous day, last 3 days, last 7 days, overall game frequency, and rest days difference.
- Match Context: Venue index, league index, stadium index, tournament ID, time of day (Morning/Afternoon/Evening), and day of the week.
- Advanced Metrics: Elo ratings, points per set averages and variances, performance after winning/losing the first set, and experienced opponent win rates.
Data Normalization
Before training or inference, all 66 features undergo Z-score normalization (standardization). The system calculates the mean and standard deviation for each feature across the training dataset and applies this transformation to ensure all input features are on a similar scale. These normalization parameters are saved to disk (ai_model.norm.json) so they can be applied consistently during inference.
3. Training Pipeline & Hyperparameter Tuning
The application provides robust tools for training models and finding the optimal configuration.
K-Fold Cross Validation
During hyperparameter tuning, the system utilizes K-Fold cross-validation (default kFolds = 3) to evaluate model configurations. It splits the training data, ensuring the model generalizes well to unseen data.
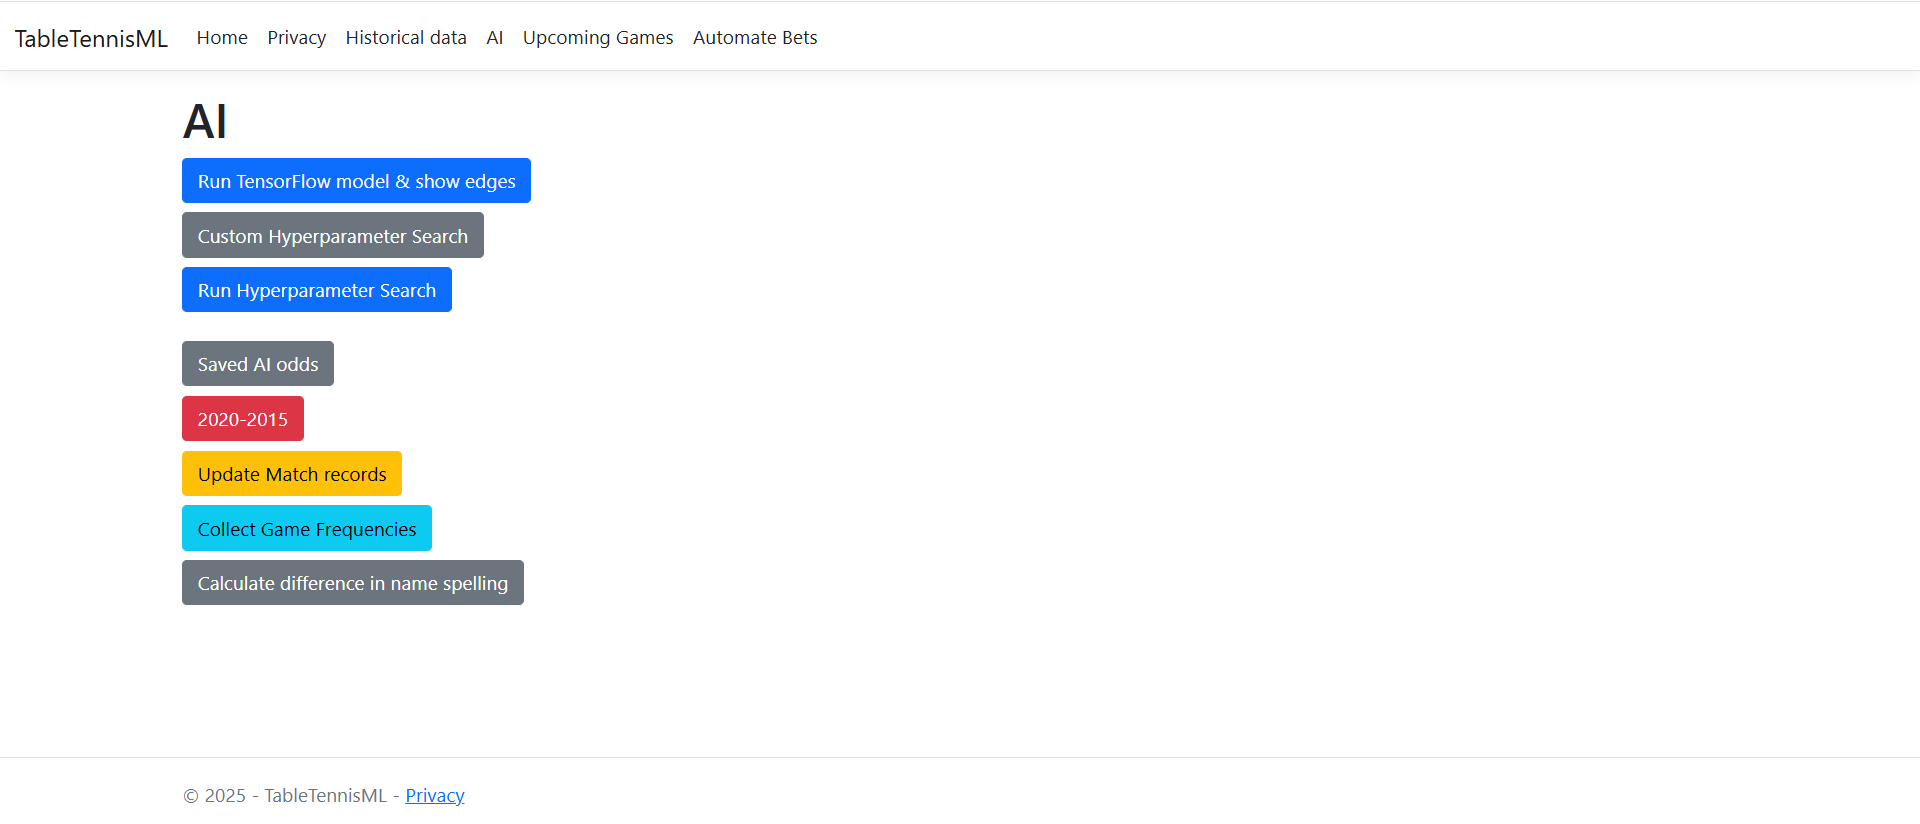
Hyperparameter Search Strategies
The program works to expose endpoints for two types of tuning:
- Randomized Search (PredictWithHyperparameterSearchAsync): Automatically searches through a randomized parameter space over a set number of iterations. It tunes learning rate (0.0005 - 0.01), units (32 - 128), and dropout (0.0 - 0.3). It tracks the best-performing configuration based on validation accuracy and narrows the search bounds dynamically around the best parameters.
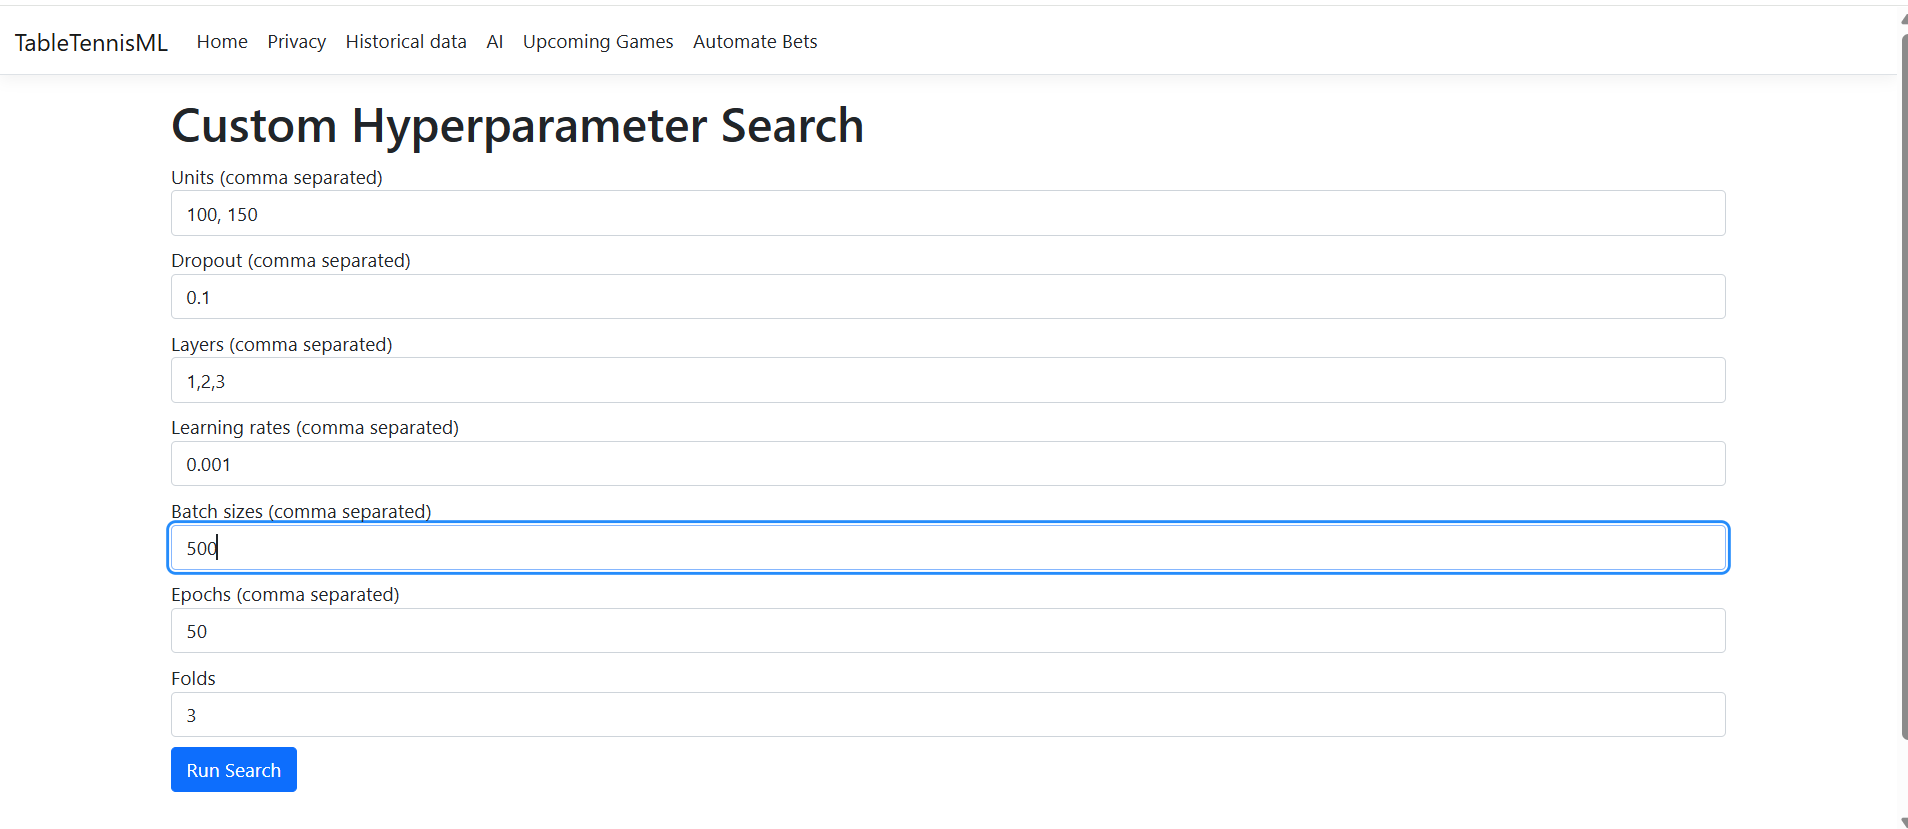
- Grid Search / Custom Search (PredictWithCustomHyperparametersAsync): Allows users to specify discrete lists of hyperparameters (units, dropout, layers, learning rate, batch size, epochs). The system generates a Cartesian product of all provided values and evaluates every combination using K-Fold validation.
Probability Calibration
To ensure the output probabilities reflect true real-world likelihoods, the system applies Platt Scaling (Logistic Calibration) to the output of the best model found during random hyperparameter search. It learns calibration parameters (_calA, _calB) to adjust the raw sigmoid outputs.
4. System Integration & Inference
The Data Lifecycle
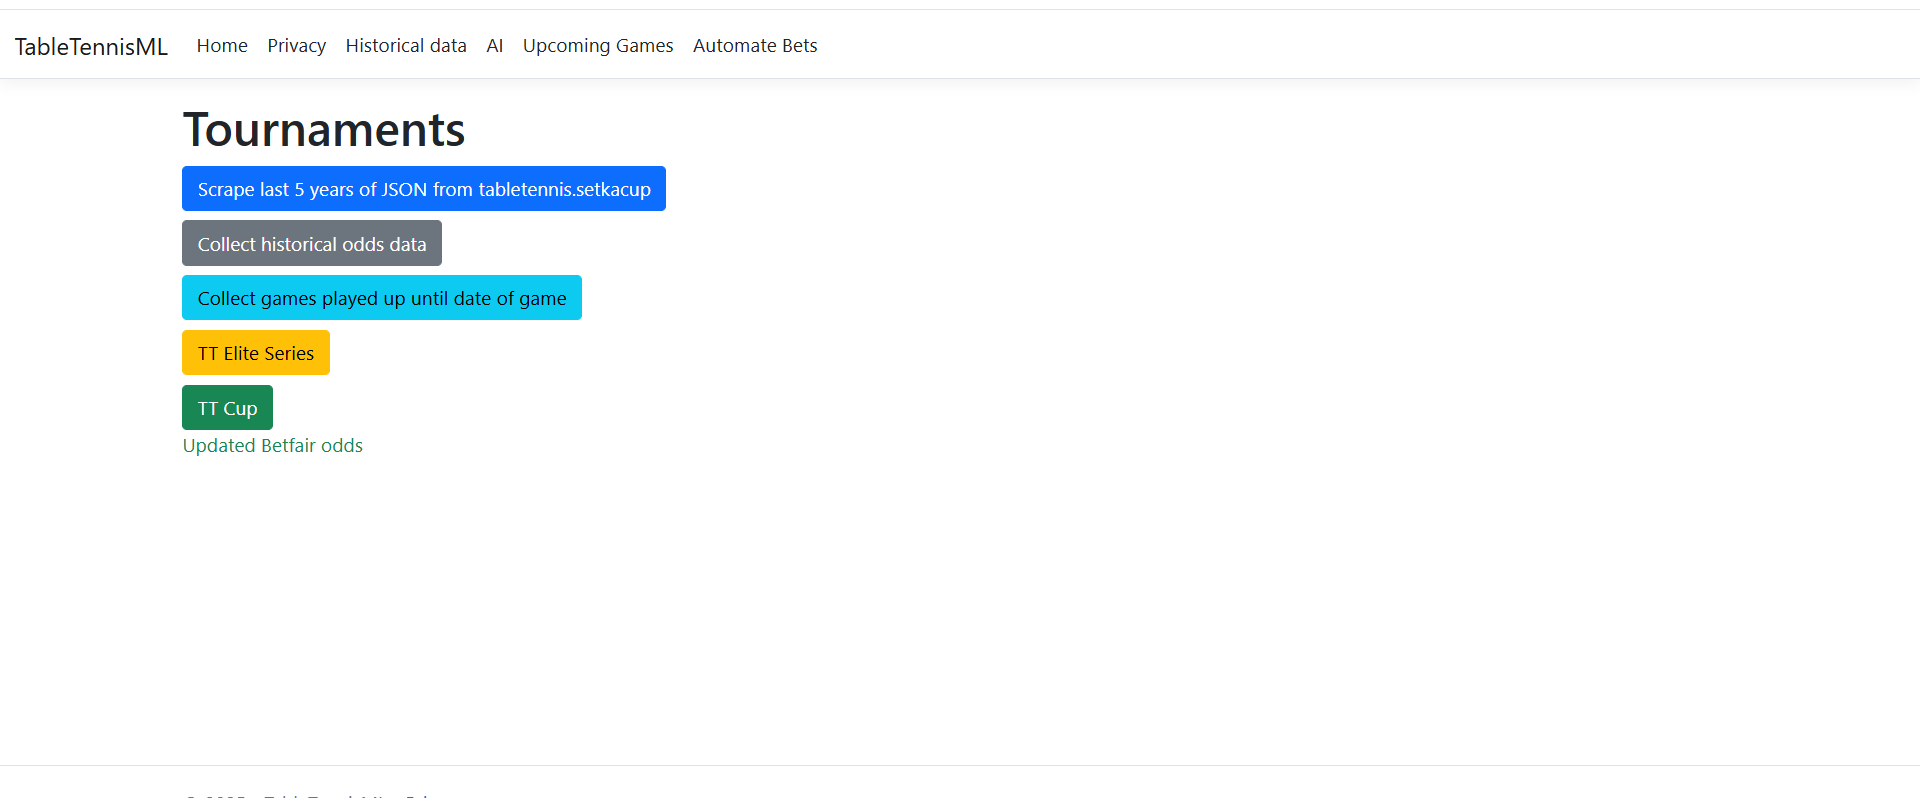
- Scraping: Background services (
BetanoOddsScraper,BetfairOddsScraper,BetsApiOddsScraper) continually fetch upcoming match schedules and bookmaker odds. - Feature Hydration: When a prediction is requested, the system retrieves the matches and queries the database (
DatabaseService) for the complex weighted statistics required to build the 66-feature vector. - Inference: The features are normalized using the saved parameters feature. This means that the program machine learning model does not have to recalculate feature weights every time, as the performance-optimised feature weights can be saved by the user
- Storage & Usage: The predicted probabilities (
P1AIWinOdds,P2AIWinOdds) are saved to the database.
Bookmaker Comparison & Automation
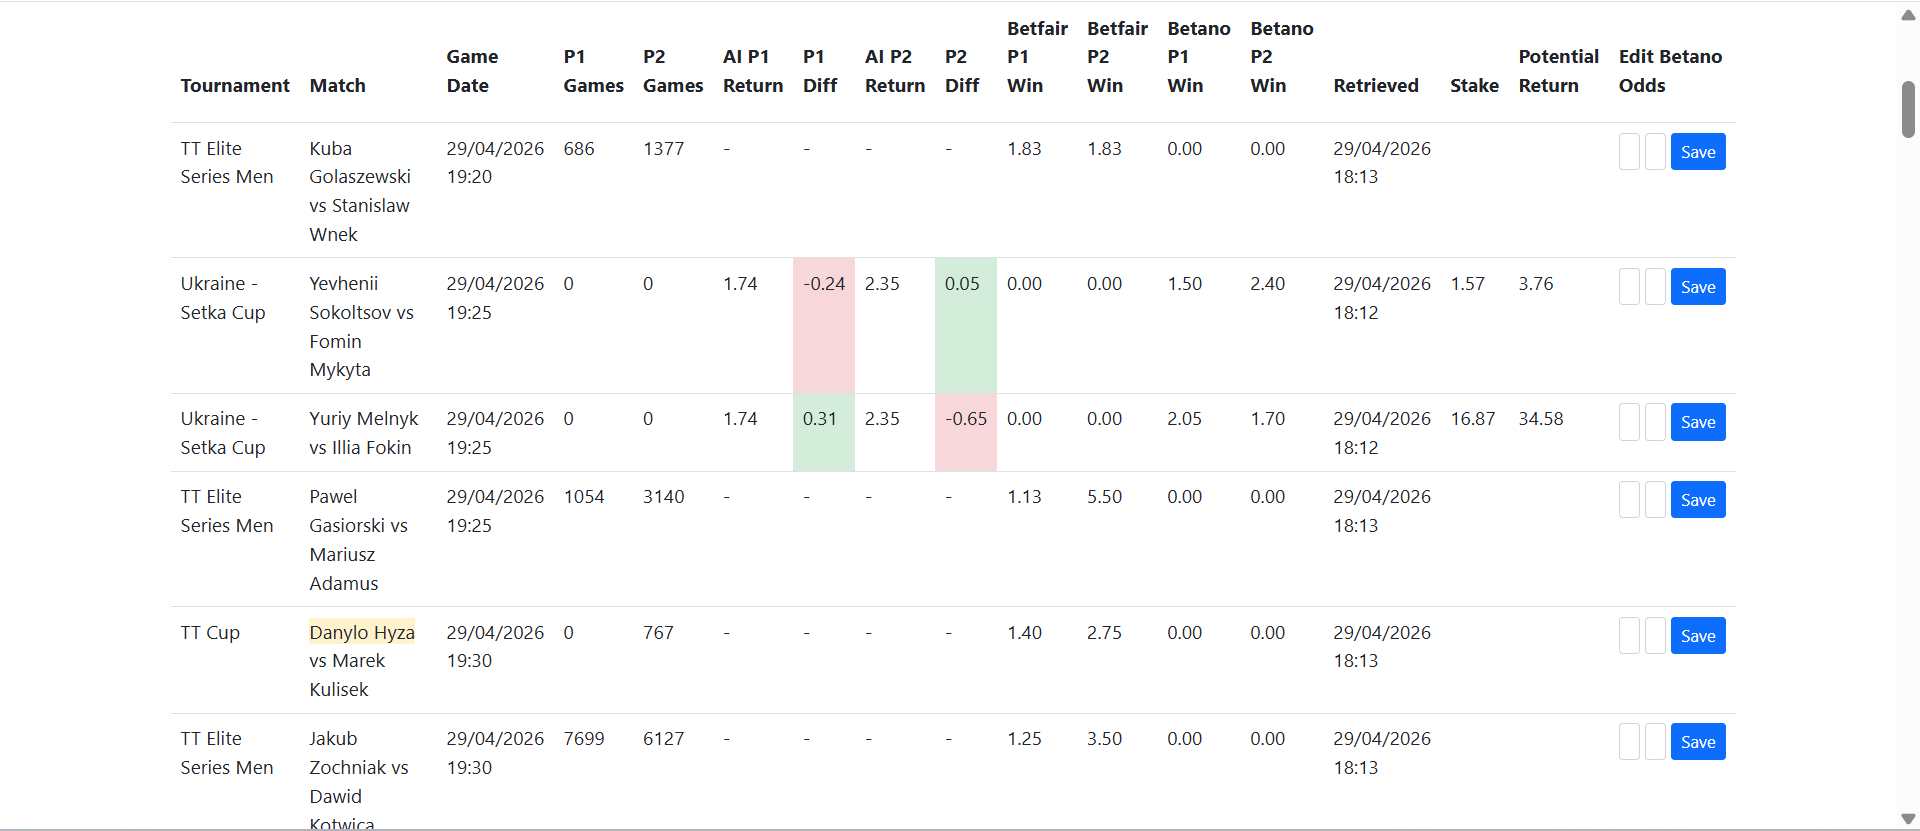
The primary goal of these ML predictions is to find discrepancies against traditional bookmaker odds.
- In the
UpcomingGamesController, the calculated AI odds are translated into "implied odds" (e.g.,1 / probability) and directly compared against Betfair and Betano odds. - A dedicated bet automation controlboard and background service exist to automatically place bets when the AI identifies a profitable edge based on its ML predictions.
Optimal Poker Decision Using Game Theory
Overview
The Poker Hand Optimiser is a sophisticated, full-stack ASP.NET Core web application engineered to calculate complex poker hand probabilities and provide Game Theory Optimal (GTO) decision matrices. This is the most common and sucesful strategy amongst the best elite poker players. Designed to handle intense computational workloads and complex state management, the application demonstrates our core competency in bridging advanced algorithmic logic with a robust, scalable web architecture.
System Architecture & Technologies
Built on the .NET 8 framework, the application utilizes a hybrid ASP.NET Core architecture, seamlessly blending Razor Pages for rapid, component-based UI development and the MVC (Model-View-Controller) pattern for structured API routing.
- Dependency Injection (DI): Leveraging ASP.NET Core's built-in DI container, core services (
GtoService,MonteCarloSimulator) are injected as Singletons or Scoped services, ensuring modularity, testability, and optimized memory usage during high-load simulations. - State Management: The application employs complex server-side data models (
GameState,PokerTable,Player) that are efficiently serialized and reconstructed across asynchronous HTTP POST requests, demonstrating mastery over stateless web environments and Razor Page model binding ([BindProperty],[FromForm]).
Core Computational Engines
1. High-Performance Monte Carlo Simulator
At the heart of the application lies a custom-built Monte Carlo simulation engine. Instead of relying on static pre-computed tables for post-flop scenarios, the system dynamically simulates thousands of board runouts to calculate real-time hand equity.
- Algorithmic Efficiency: The engine runs high-volume iterations (e.g., 1,000+ runouts per request), mathematically shuffling virtual decks, dealing missing cards to opponents and the board, and evaluating outcomes.
- Performance: Code paths within the simulation loop are strictly optimized to minimize object allocation and garbage collection overhead, allowing near-instantaneous equity calculations returning actionable data.
2. Hand Evaluation Algorithm
The Hand Evaluator implements a highly optimized algorithm to parse, rank, and compare 7-card Texas Hold'em hands.
- Combinatorics & Sorting: It evaluates all possible 5-card combinations from a 7-card pool to determine the absolute highest rank (from High Card to Royal Flush).
- Tie-Breaking Logic: The algorithm includes precise kicker-resolution logic, essential for accurately determining split pots in the Monte Carlo engine.
3. Game Theory Optimal (GTO) Decision Matrix
The software integrates complex, static preflop ranges via the GtoService.cs.
- Data Structures: GTO charts for 6-max tables are stored as highly optimized Dictionary lookups (
Dictionary<string, GTOData.Action>), mapping specific hand permutations (e.g., "AKs", "JTo") to the mathematically optimal preflop action (Raise, Call, Fold). - Positional Awareness: The service dynamically adjusts its recommendations based on the player's exact geometric position at the table (UTG, Cutoff, Button, etc.), cross-referencing the correct subset of the GTO decision matrix.
Conclusion
The Poker Hand Optimiser serves as a prime example of our ability to architect robust web applications that require more than just basic CRUD operations. By combining the enterprise-grade stability of ASP.NET Core with custom, computationally intensive algorithms (Monte Carlo) and advanced data structures (GTO matrices), we deliver high-performance software capable of solving complex mathematical and logical challenges.
LocateMe: Privacy-First Background Location Tracker
LocateMe is an Android mobile application built with Flutter that provides continuous, background-level geolocation tracking. Designed with a strict privacy-first architecture, the application operates entirely on-device without any reliance on external servers or cloud infrastructure. It demonstrates robust handling of device hardware permissions, background process lifecycle management, and efficient local data persistence.
Technical Architecture & Stack
- Framework: Flutter & Dart (Cross-platform compilation for iOS and Android)
- Local Storage & Persistence: Hive (NoSQL, pure Dart key-value database)
- Geolocation & Background Processing: Geolocator, flutter_foreground_task, Workmanager
- Mapping & Visualization: flutter_map (OpenStreetMap tile rendering), latlong2
- State Management: Reactive ValueNotifiers and Hive Listenables
Core Capabilities & Engineering Highlights
- Continuous Background Execution & Hardware Access: Engineered to run persistently in the background, the app utilizes device OS APIs to continuously sample GPS coordinates. This requires sophisticated handling of Android lifecycle events, ensuring the process remains active and resource-efficient even when the app is suspended.
- Ephemeral Rolling Buffers: Implemented a rolling buffer mechanism for location data. The app temporarily stores the last X minutes of coordinate data in memory/local storage, continuously overwriting older data to optimize memory footprint and prevent device storage exhaustion.
- Privacy-By-Design Data Architecture: A fundamental architectural decision was made to keep 100% of the data on-device. No telemetry, analytics, or user data is transmitted to remote servers. All data reads/writes interface exclusively with local device storage (via Hive), mitigating data breach vectors and ensuring compliance with stringent privacy standards.
- Efficient Local Persistence (Hive): Replaced traditional SQLite implementations with Hive, a lightweight, fast, NoSQL database. Custom TypeAdapters were generated for domain models (e.g., LocationPoint), enabling rapid, synchronous read/write operations critical for high-frequency GPS coordinate logging.
- Reactive UI & Complex State Management: The user interface heavily leverages ValueListenableBuilder tied directly to Hive boxes and application-level ValueNotifiers. This reactive paradigm ensures the Map UI, timestamp markers, and tracking status toggles update instantly as new GPS coordinates are processed in the background, without requiring heavy state management libraries like BLoC or Riverpod for this specific scope.
- Interactive Spatial Data Visualization: Integrated flutter_map with OpenStreetMap tile layers to plot historical location data. Developed custom filtering logic allowing users to query historical datasets by complex constraints (e.g., custom date ranges, specific times of day) and render the filtered coordinate sets efficiently as map markers using latlong2.
- Robust Permission Management: Implemented a robust permission flow using permission_handler to negotiate complex OS-level permission states (Foreground Location, Background/Always Location). The app gracefully degrades functionality based on the authorization state, providing explicit feedback to the user regarding required permissions.
Conclusion
LocateMe showcases an ability to build performant, hardware-interfacing mobile applications that prioritize user privacy and resource efficiency. It highlights practical experience in managing background execution constraints, reactive UI patterns, and offline-first data architectures within the Flutter ecosystem.
Voice Recording App

Advanced Voice Recorder App Overview
We recently engineered a highly robust, pure voice recording application in Flutter that goes far beyond standard functionality. This app was designed to provide uninterrupted, long-term audio capture with an intelligent, self-managing storage system, demonstrating our team's ability to handle complex system-level integrations and background processing.
Key Technical Achievements
- Resilient Background Execution: Implemented a resilient background service architecture utilizing
flutter_foreground_taskandworkmanager. This ensures the app can reliably record audio for extended periods (up to 24 hours continuously) without being terminated by the operating system, even when the device is locked or other apps are in use. - Intelligent Rolling Audio Buffer: To manage device storage efficiently during long recording sessions, we developed a sophisticated rolling buffer system. The app records audio in seamless 1-minute chunks, automatically pruning older files based on user-defined retention settings (e.g., keeping only the last 12 hours).
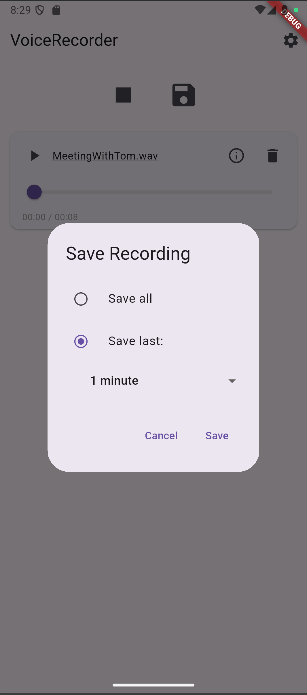
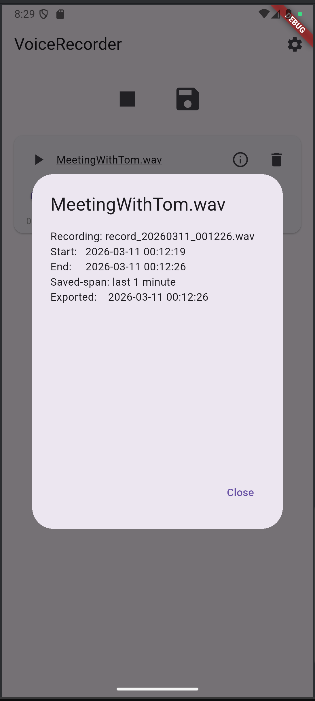
- On-Demand Binary Audio Assembly: Instead of saving massive, monolithic audio files, the app allows users to retrospectively save specific segments (e.g., "save the last 30 minutes"). To achieve this, our team wrote custom Dart logic to read the raw PCM binary data from the temporary chunks, stitch them together seamlessly in memory, and generate a perfectly formed
.wavfile complete with a dynamically constructed RIFF/WAVE header. - Robust Local Data Management: Utilized
Hivefor lightning-fast, NoSQL local storage to persist user settings and application state across sessions, ensuring a seamless user experience.
This project showcases our collective expertise in Dart/Flutter, advanced background task management on Android/iOS, file system operations, and low-level binary data manipulation. It highlights our capability to build reliable, high-performance applications that solve complex real-world problems.